
The Pitching side of the Tout Wars NL 2013 Hypothetical Standings
In the first part of this comparison of the Hypothetical Draft Day Standings and the End of Season Standings in Tout Wars NL, we saw that Tristan Cockcroft finished in first place, even though he bought the fourth-best team at auction.
We also learned that Lenny Melnick added a lot of hitting points after the auction, and that in each of the hitting counting categories, Tout teams as a whole were able to add about 10 percent more stats after the auction.
So, what now about pitching?
WINS
The big takeaway here is that Tristan Cockcroft added seven points in Wins during the season, and Phil Hertz lost six. If they had played Draft and Hold style, Phil would have finished with just one half fewer points than Tristan. But instead, they played it out, and Phil finished 21 points behind Tristan.
It turns out that Tout teams added almost 19 percent more wins to those they bought at the auction. Every team but one added wins on the year, with Cockcroft adding 31, the most.
But Lenny Melnick added 26, also a lot. The problem for Lenny was that his opening day staff was so bleak that despite adding all those wins he gained only one point in the category.

Phil Hertz basically stood still, and given where he started from, that allowed six other teams to pass him.
SAVES
Lenny Melnick loaded up on points in Saves, too. He and Mike Gianella bought no saves on draft day, but both went to town and added more than 50 saves apiece during the year.
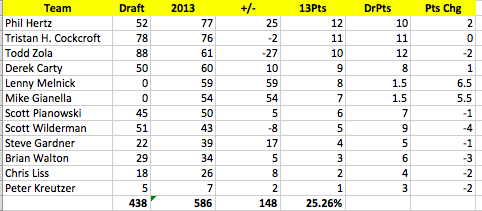
Todd Zola was the big seller, trading off 27 saves, which cost him just two points. How can teams add so many saves with so few sellers? More than 25 percent of the total saves Tout teams collected during the season were not bought on draft day.
This is a number that surely fluctuates from year to year, so it’s possible last year in the NL was an extreme case. But not necessarily. Every time a closer is ineffective or gets hurt his team’s saves go to some other pitcher, usually one who wasn’t expected or paid at auction to be a closer. This makes the saves category different than every other category.
Despite my woeful numbers I was able to pick off a new midseason closer, in Brad Ziegler, but my situation in the category was so bleak I traded him for something I needed.
STRIKEOUTS
Cockcroft is another big gainer here. He added 479 strikeouts during the season, a whopping big number, which gained him nine points in the standings. The next biggest gainer was Lenny Melnick, which gained him five points.
I gained the fewest, because I started the season with a good staff and spent the season stripping it to help my offense, with minimal success.

Once again, a pitching category adds about 20 percent in stats from outside the draft day pool. Is it coincidence that we spend two thirds of our budget on hitters, when the amount of pitching stats available after the auction is twice as much as hitting stats? It’s funny how that 2:1 ratio keeps recurring.
EARNED RUN AVERAGE
Tristan Cockcroft bought only 750 or so innings in the auction, which is why he had to add so many strikeouts and wins. It came at a cost, as his ERA increased by two tenths of a run on the season. That would have hurt him if his draft day staff wasn’t so good. As it was, the ERA increase cost him just one point.
Mike Gianella, who spent nearly half less than the average team on pitchers, was able to add quality innings to his team and gained four points in ERA.
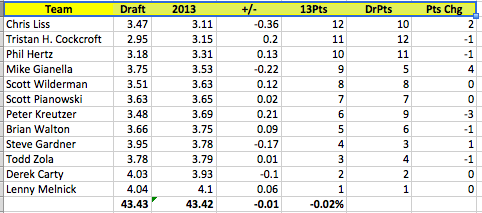
I traded pitching and bled points here, too.
But all in all, the hunt for Wins and Strikeouts didn’t hurt overall ERA quality much across the league. Simply, some gained, some lost.
WHIP
Chris Liss did a great job adding quality innings. It didn’t amount to many additional points in ERA, but he gained four in WHIP, jumping to second from sixth. Gianella didn’t improve much, but gained four points, too.
As you might expect, WHIP follows a similar pattern to ERA, to my chagrin.
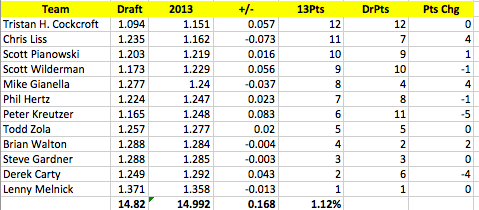
THE FINAL STANDINGS
Here’s a different look at the final standings, sorted by the actual finish.
 It’s another way of seeing what teams helped and hurt themselves.
Most notably, Lenny Melnick helped himself, climbing out of the deep basement to finish ninth. That’s heroic effort, if the final result isn’t all that exciting.
The big question is whether it is coincidence that the two teams that spent the least money on pitching finished in the top two on the year, in large part because of all the pitching points they were able to add.
And is it coincidence that many of the teams that lost points spent more than average on pitching?
Let’s take a look at that next time, when we look closer at what teams did to gain and lose points.


You must be logged in to post a comment.