In recent years Mike Gianella has done exhaustive reviews of the previous year’s fantasy prices and compared them to what actually happened on his site Roto Think Thank. One of the features I liked was that he included my bid prices in the review, so I could see how I ended up without having to do the work myself.
Mike’s work is now behind the paywall at Baseball Prospectus, which means not everyone can see it, and he’s now using his own projected bid prices rather than mine, which means it behooves me to do the work. Looking back is an important part of improving going forward.
One important thing about the charts to note is that the three expert leagues auctions are held at different times. The CBSsports auction comes near the end of February, the LABR auction is held around March 7th, and Tout Wars is held a week before the season starts. When you see a big divergence in prices, you can assume that there was some (usually injury) news that changed thinking about that player.
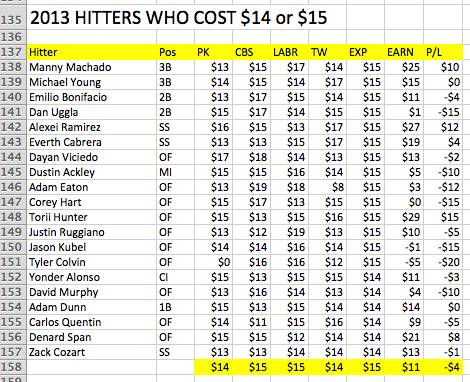
The first chart list the highest priced hitters in 2013, those that cost more than $30. (The three expert leagues spent about 69 percent of their budgets on hitting, so I scaled my prices to that apportionment.)
Selecting the players with the highest expectation always leads to a depressing sense of failure. On average we lost about $11 per player on the $30+ hitters, which stinks. Only four of these players earned a profit. Still, they earned on average $24, which is better than the hitters who cost $24 did.
Six of these hitters earned a profit, but on average they lost $4. But only three of these hitters earned $30, while five of the more expensive hitters did. It seems that if you want to invest in guys who generate lots of stats you’re going to have to pay, even though they have a high failure rate.
So cheaper must be where the profits are, right?
Nope. These guys lose $4 on average, too!
The fact is that our preseason expectations of players are awash with expectations that do not come to fruition. None of these guys earns $30 and there are plenty of double-digit failures. How can this be?
On draft day it turned out we spent $4355 for $3811 of value. To make up the difference, we bought $323 worth of players who earned negative values, and left $215 of value go unbought. Assuming these numbers are typical, that’s a rate of expected breakage of 12 percent for hitters.
We’ll have to run the numbers on pitchers to see what sort of breakage rate we have with them. But clearly, getting hitters who go on to perform up to expectations is a big advantage on draft day.
UPDATE: How do all the players who were bought in March do?
24 of them cost $30 or more, a total of $716 in March and earned $457 last season, losing 36 percent.
57 cost $20 to $29 for a total of $1382 in March, and earned $1292, a loss of seven percent.
111 cost $10 to $19 for a total of $1648 in March, and earned $1434, a loss of 13 percent.
141 cost $1 to $9 for a total of $609 in March, and earned $629, a gain of three percent.


You must be logged in to post a comment.