PLEASE NOTE: The original posting didn’t include Jose Fernandez in the Biggest Earners and Biggest Profits charts because of a join issue. He is included now.
How about if we compare the return from the Top Starters to the return from the Top Relievers. That is, the starters and relievers we paid the most for last March.
The Top Starters list looks a lot like the Most Expensive Pitchers list.
And like the Most Expensive Pitchers, the damage is relatively light. This group loses 16 percent off its draft pricing (though again, the damage is mitigated by Clayton Kershaw’s remarkable gain). Take Kershaw out and the loss is 24 percent.
That matters, because look at the rate of return on the Most Expensive Relivers.
This works out to a 28 percent loss, not much worse than the Kershaw-less starters. As a point of reference, the Top 15 2012 Starters had an average cost of $27 and earned $20 on average, a rate of loss of 25 percent. Kershaw definitely moved the bar last year.
A look at 2013 Top Earners shows that the big money was mostly earned by guys who had been paid a real salary.
These guys earn a 71-percent profit. There is money to be made out there.
The trick is avoiding the losers.
Many of these guys were not drafted or quickly dropped, so they didn’t actually do the full damage they’re credited with. But the lesson here isn’t to avoid the inexpensive pitchers.
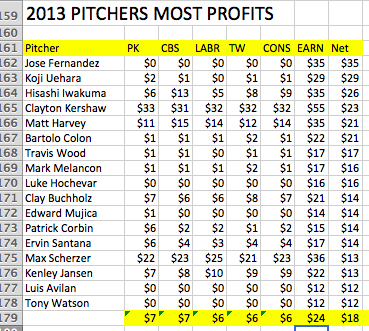
Many of the biggest profitmakers were very inexpensive on auction day. Of course, it doesn’t hurt to pull a closer out of the $1 bin, but some retread starters emerged, too.
While big losses accrued to pitchers of all classes.
Good trusted pitchers and risky rag arms alike failed last year. Some were freakish, some were sort of predictable, some were easy to escape from but some were not. Properly managing those situations is so very important, and difficult.


You must be logged in to post a comment.